
With its 48-square-mile city limits housing around 675,000 people and a bustling greater Boston area population of approximately 4.3 million, it’s clear that this compact slice of the Northeast is densely packed. So the question is, is Boston safe??
I’ve visited the city countless times. My experiences have largely left me feeling secure, though, like any major city, it comes with its set of precautions.
In this post, I’ll get into the current state of crime rates, and share some practical safety advice.
Key Takeaways
- In 2024, Boston has a crime rate of 6.6 incidents per 1,000 people.
- Boston was recognized as the nation’s second-safest city in 2023, following closely behind Dallas,
- There have been 4,293 violent crimes reported in the city, which is over twice the average for the entire state of Massachusetts.
- In terms of specific crime numbers, Boston reported 14,489 property crimes in 2023
- The city recorded a historic low in its murder rate in 2023, with 37 homicides, which is below the five-year average of 49.
Crime Stats
In 2023, Boston earned the title of the nation’s second-safest city, right behind Dallas. This accolade came from a CBS News report[1] which in turn, cited a Gallup survey. It’s fascinating how these surveys work, gathering insights from everyday people across the country about their perceptions of safety.
But, you know, the concept of safety can be pretty subjective. It might depend on which part of Boston you’re in, whether you’re thinking about violent crimes or maybe property crimes, or even your own experiences and feelings of security in the city.
| Crime Type | Number of Incidents | Rate (per 1,000 residents) |
|---|---|---|
| Violent Crimes | 4,293 | 6.6 |
| Property Crimes | 14,489 | N/A |
Looking into the specifics for Boston, as we move through 2024, the city’s crime rate stands at 6.6 incidents per 1,000 residents.[2] That translates to 4,293 violent crimes, a figure that’s over twice the state average for Massachusetts. On the property crime front, there were 14,489 incidents reported in 2023 according to the Opendata network[3] .
Despite these numbers, there’s a silver lining. Boston saw its lowest murder rate in years in 2023, with 37 homicides.[4] When you compare that to the five-year average of 49 homicides[5] it’s a notable improvement. The District Attorney’s office has been busy, too, with 24 arrests, 19 pleas, and 12 convictions related to these cases. This drop in homicides came alongside a decrease in both fatal and non-fatal shootings — from 32 to 26 for fatal shootings and from 148 to 118 for non-fatal shootings according to this report from Boston Police[5.1].
| Statistic | 2023 | 5-Year Average |
|---|---|---|
| Homicides | 37 | 49 |
| Fatal Shootings | 26 | – |
| Non-Fatal Shootings | 118 | – |
District Attorney’s Office Achievements in 2023
| Outcome | Number |
|---|---|
| Arrests | 24 |
| Pleas | 19 |
| Convictions | 12 |
However, it’s not all good news. The city saw an uptick in other serious crimes. The number of rapes increased slightly from 186 to 194, and robberies also saw a rise, from 778 to 845 according to the same report.
It’s a mixed bag, really. On one hand, you have some genuinely encouraging signs that Boston is becoming a safer place. On the other, there’s clear evidence that there’s still a lot of work to be done.
Changes in Other Serious Crimes (2023 vs. Previous Year)
| Crime Type | 2023 | Previous Year |
|---|---|---|
| Rapes | 194 | 186 |
| Robberies | 845 | 778 |
Crime Trends

The crime rate in Boston is higher than the national average across all communities in America, with 25 crimes per one thousand residents. However, Boston’s rate is lower than most communities of similar population sizes across America. This suggests that while Boston faces challenges, the city is relatively safe compared to other cities[4.1] of its size.
Violent crimes in Boston are a significant concern, with a rate that is one of the highest in the nation across communities of all sizes. Violent offenses tracked included rape, murder, non-negligent manslaughter, armed robbery, and aggravated assault, including assault with a deadly weapon. According to the available data, the chance of becoming a victim of one of these crimes in Boston is one in 166.
Boston’s rate for property crime is 19 per thousand population, which is higher than the national average. Property crimes include motor vehicle theft, arson, larceny, and burglary. The chance of becoming a victim of any of these crimes in Boston is one in 54.
Boston has the highest crime rate in New York, with 6.6 per 1,000 residents, while Manhattan’s sitting at 5.21 per 1,000 residents.
Police Presence
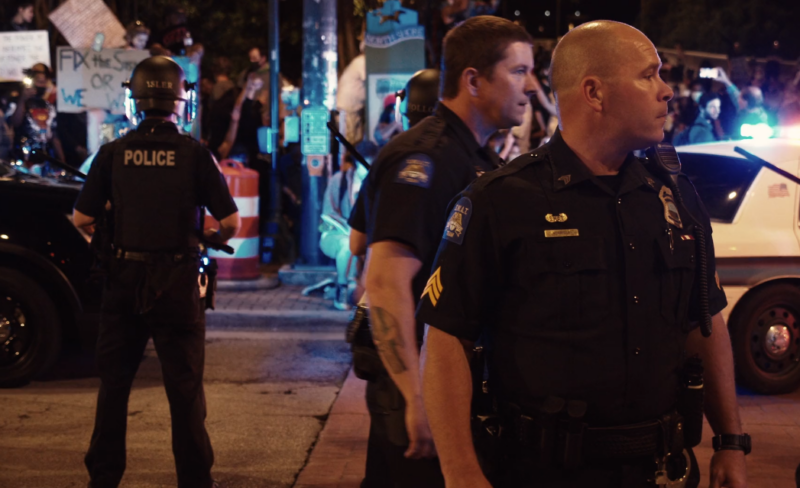
A few years back, Boston’s Police Department found itself in a bit of a bind with a wave of retirements depleting its ranks.[1] This situation sparked some serious concerns about whether the force could keep up with the city’s demand for safety and timely response to emergencies. But, facing these challenges head-on, there’s been a noticeable effort to bounce back, with improvements in both staffing levels and how the department operates day-to-day.
Looking into the finances, the Vera Institute points out[6] that Boston has earmarked a whopping $431,731,291 for policing, which represents 16% of the city’s budget. That’s a significant chunk of change, breaking down to about $595 dedicated to policing for every Boston resident. With a ratio of one police department employee for every 229 people, it’s clear the city isn’t skimping on law enforcement, signaling a hefty investment in maintaining public order and safety.
The Boston Police Department’s (BPD) budget taps into a variety of sources, but it’s primarily funded through the city’s general fund. This pot of money is the main engine for the city’s operations and gets a boost from additional financial support that trickles in from local, federal, and state coffers.
This financial setup underpins everything the BPD does, from covering the cost of its workforce, training programs, and necessary equipment, to fostering community policing efforts that aim to bridge the gap between officers and the communities they serve.
Safety Perception
| Safety Concern | Perception Score | Category |
|---|---|---|
| Level of Crime | 44.23 | Moderate |
| Increasing in the Past 3 Years | 54.68 | Moderate |
| Worries of Home Being Broken Into and Things Stolen | 34.73 | Low |
| Worries of Being Mugged or Robbed | 35.55 | Low |
| Worries of Car Being Stolen | 30.45 | Low |
| Worries of Things From Car Being Stolen | 43.20 | Moderate |
| Worries of Being Attacked | 35.22 | Low |
| Worries of Being Insulted | 37.70 | Low |
| Worries of Being Subject to a Physical Attack Because of Skin Color, Ethnic Origin, Gender, or Religion | 25.68 | Low |
| Problem of People Using or Dealing Drugs | 52.99 | Moderate |
| Problem of Property Such as Vandalism and Theft | 44.63 | Moderate |
| Problem of Violent Such as Assault and Armed Robbery | 40.35 | Moderate |
| Problem of Corruption and Bribery | 39.40 | Low |
| Safety Walking Alone During Daylight | 81.43 | Very High |
| Safety Walking Alone During Night | 57.32 | Moderate |
| Overall Safety Index | 60.68 | Moderate |
Talking about Boston’s safety, it feels pretty good overall, with a Safety Index of 60.68 Based on the stats I checked out on Numbeo [1], it’s pretty clear. It’s like most people generally see the city as a safe place. But, of course, how safe you feel can really change based on where you are in the city, what time it is, and your own experiences.
Crime seems to be a moderate concern for many, especially with regards to things like drug use, property crimes, and violent incidents.
But on a day-to-day basis, I would feel super safe walking around during the day. Nighttime’s a bit different, with that feeling of safety dipping a bit, but still, it’s not too bad.
It just goes to show how layered safety can be, and it highlights the need for all of us to keep working together to make Boston even safer.
Methodology
For my analysis of crime rates in Boston, MA, I mostly relied on the crime data annually published by the FBI and city police. This data is released in two key segments: a preliminary overview focused on the nation’s largest cities, followed by a detailed year-end report.
- Per Capita Violent Crime Rates
- Per Capita Property Crime Rates
In pursuing a nuanced examination, our study predominantly concentrated on Boston while also integrating comparative data from other Massachusetts cities for a more rounded state-wide perspective.
Massachusetts isn’t considered one of the most threatening states in the US, but with its crime rate jumping in the last few years, you should keep your eyes open on the street.
References
- CBS News
- Neighborhood Scout
- Open Data Network:
- Boston.com
- Boston Police Department
- Vera Institute of Justice
- Numbeo
- Final Words
Boston stands out as a relatively safe city, especially when you compare it to other large cities in the U.S. Its crime rate is just a bit above the national median, which says a lot about the community and its priorities.
The city allocates a generous budget to its police force, further reinforcing the commitment to keeping residents safe.