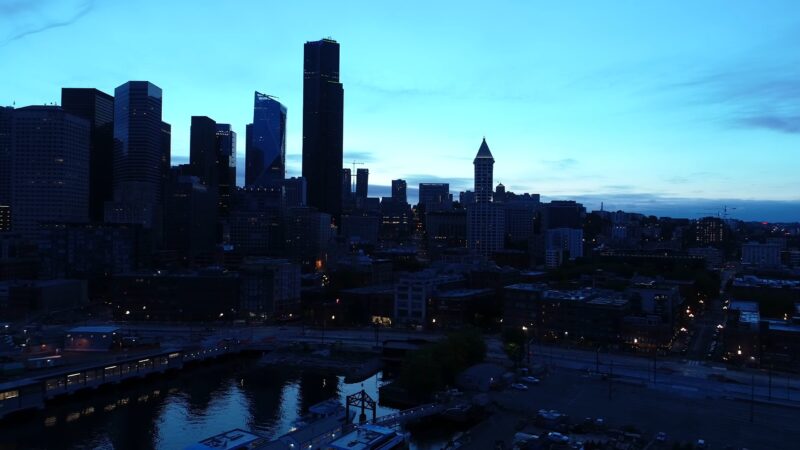
Seattle stands as the largest city in the Pacific Northwest and ranks among the fastest-growing major cities in the country.
I find it fascinating that it’s about 100 miles from the Canadian border, making it the northernmost major city in the U.S. Not to mention, its port ranks as the fourth-largest in North America.
The city boasts landmarks like the iconic Space Needle and hosts major companies such as Boeing, Microsoft, and Amazon.
When it comes to safety, I believe Seattle is a safe place to live. Like any major city, it experiences a higher crime rate, but that’s a common trait among large urban areas.
Certain parts of the city do have higher crime rates and are best avoided.
Key Takeaways
Crime Stats
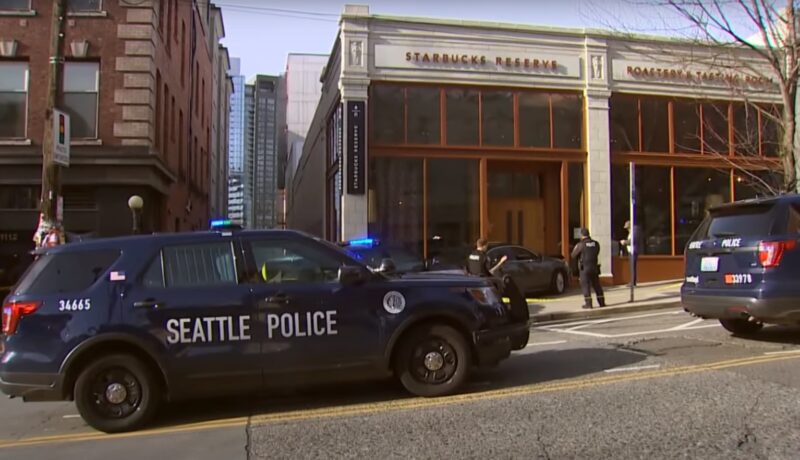
Seattle, with a population of over 700,000, is the largest city in Washington State and the Pacific Northwest region. The city’s rate is a topic of concern for residents, policymakers, and law enforcement agencies. According to Seattle.gov[1], the total number of crimes in the past three months is 3,482.
Seattle’s unique location and diverse, tech-driven economy pose challenges for its police force. Despite these challenges, the city has seen progress in reducing crime. However, more efforts are needed.
The Seattle Police Department and other agencies are refining their strategies to address crime more effectively. They collaborate with community organizations and residents to enhance trust and safety.
This shows us that urban violence is complex, just like in other cities dealing with their own mess. We gotta mix it up with different strategies to actually cut down on all the incidents.
Violent And Property Crimes Statistics
| Crime Type | Seattle 2024 |
|---|---|
| Violent Crime | 429 |
| Property Crime | 3,053 |
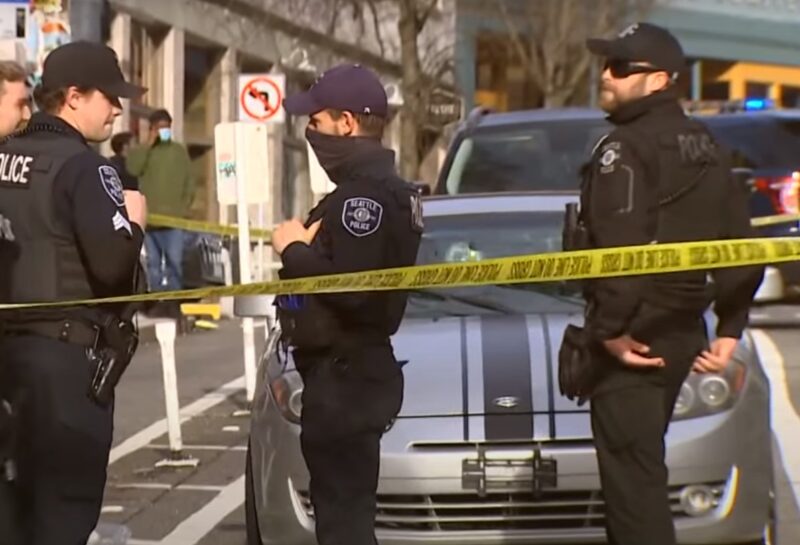
According to data from NeighborhoodScout[2], the chance of becoming a victim of a violent crime in Seattle is 1 in 122, compared to 1 in 266 in Washington state overall. This indicates that while the violent rate is higher in Seattle than in the state as a whole, the risk is still relatively low compared to other major cities.
Despite these efforts, certain areas of the city continue to experience higher rates of violent crime. These areas often face a range of complex social and economic challenges, including poverty, unemployment, and lack of access to quality education and healthcare.
The likelihood of experiencing property crime is 1 in 17, whereas it’s 1 in 30 for Washington as per same source.
These crimes are fueled by various issues such as drug addiction[3], poverty, and unstable housing situations[4],. They significantly affect residents’ quality of life and can lead to increased feelings of insecurity and fear.
Comparing the Past Years
| Offense Category | Offense | 2022 | 2021 | 2020 | AMT CHANGE (2022-2021) | % CHANGE (2022-2021) |
|---|---|---|---|---|---|---|
| Violent | ||||||
| HOMICIDE | 52 | 40 | 53 | 10 | 24% | |
| RAPE | 281 | 253 | 270 | 11 | 4% | |
| ROBBERY | 1,760 | 1,752 | 1,487 | 5 | 0% | |
| AGGRAVATED ASSAULT | 3,498 | 3,295 | 2,656 | 172 | 5% | |
| Violent Total | 5,591 | 5,340 | 4,466 | 198 | 4% | |
| Property | ||||||
| ARSON | 181 | 224 | 171 | -43 | -19% | |
| BURGLARY | 8,657 | 9,787 | 10,443 | -1,169 | -12% | |
| LARCENY-THEFT | 28,228 | 26,733 | 23,188 | 1,252 | 5% | |
| MOTOR VEHICLE THEFT | 6,920 | 5,305 | 4,912 | 1,596 | 30% | |
| Property Total | 43,986 | 42,049 | 38,714 | 1,636 | 4% | |
| Grand Total | 49,577 | 47,389 | 43,180 | 1,834 | 4% |
Source: Seattle.gov
6 Riskiest Places in Seattle
1. Sand Point[5] really stands out for its alarmingly high violent crime rate of 3,467 incidents per 100k people. That’s over three times the Seattle average, which is especially worrying given its small population of just 788 people. This statistic makes it the most concerning area in terms of violent crime.
2.Following closely is First Hill[5.1], where the vibrant city life is overshadowed by a violent crime rate of 2,261 incidents per 100k people. This rate is 170% higher than Seattle’s overall average, which is significant for an area housing 13,005 residents.
3. South Lake Union[5.2], known for its tech-driven revitalization, has not been spared, showing a violent crime rate of 1,963 incidents per 100k people, 134% more than the Seattle average, amidst its 7,155 residents.
4. Atlantic[5.3], with a community of 5,555, faces a violent crime rate of 1,946 incidents per 100k people, or 132% above Seattle’s average, highlighting significant safety concerns.
5. Northgate[5.4], though slightly better, still reports a violent crime rate of 1,897 incidents per 100k people among its 4,414 inhabitants, 126% more than the city’s norm.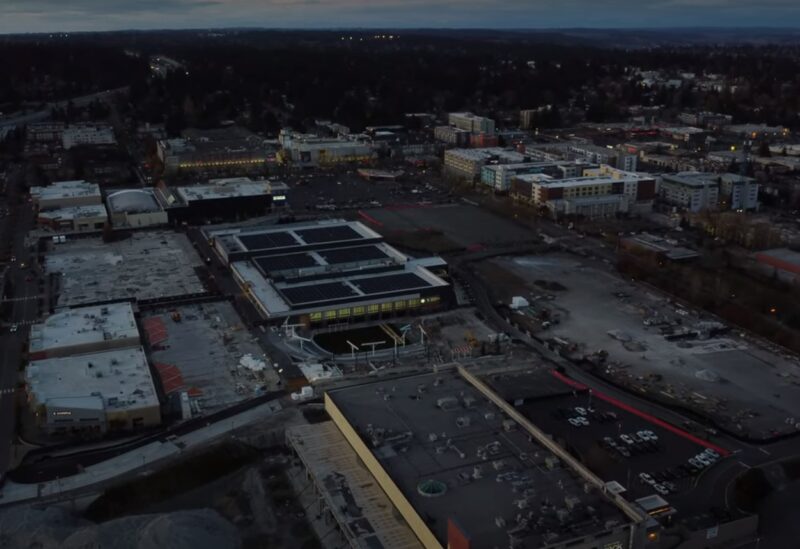
6. Haller Lake[5.5] presents a somewhat lower but still concerning figure, with a violent crime rate of 1,429 incidents per 100k people, 71% higher than Seattle’s average, in its population of 9,105.
METHODOLOGY
For our analysis of Seattle’s crime rates, we use the annual crime data provided by the FBI and the city’s police department. This data comes in two main parts: an initial summary targeting the largest cities in the U.S. and a year-end report.
Our investigation focuses on two main indicators:
- Violent Crime Rates Per Capita
- Property Crime Rates Per Capita
Our detailed study primarily looks at Seattle but also includes data from other cities in Washington for a broader statewide comparison.
FAQ
Final Thoughts
References:
1. Seattle.gov: https://www.seattle.gov/police/information-and-data/data/crime-dashboard
2. NeighborhoodScout: https://www.neighborhoodscout.com/wa/seattle/crime
3. Substance Abuse and Mental Health Services Administration: https://www.samhsa.gov/data/sites/default/files/NSDUHMetroBriefReports/NSDUHMetroBriefReports/NSDUH-Metro-Seattle.pdf
5. AreaVibes: https://www.areavibes.com/seattle-wa/sand+point/crime/
- 5.1: https://www.areavibes.com/seattle-wa/first+hill/crime/
- 5.2: https://www.areavibes.com/seattle-wa/south+lake+union/crime/
- 5.3: https://www.areavibes.com/seattle-wa/atlantic/crime/
- 5.4: https://www.areavibes.com/seattle-wa/northgate/crime/
- 5.5: https://www.areavibes.com/seattle-wa/haller+lake/crime/